Survey Gazetteer Digitisation
Posted 3/8/2015
Rebecca Banks discusses Survey Gazetteer Digitisation
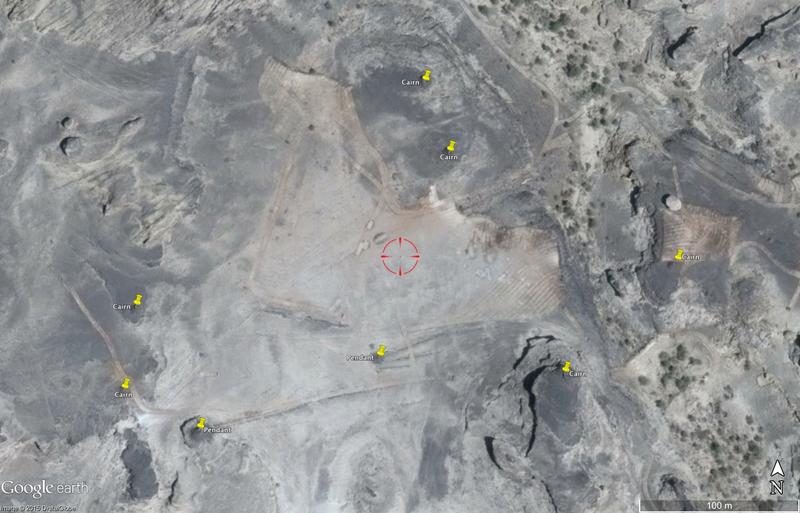
One of the principal aims of EAMENA is the survey of archaeological sites for threat or disturbance through the use of satellite imagery and aerial photographs. The compilation of what archaeology or heritage is there to begin with, before we can access how it has been impacted over time, is a many-faceted process. One of my tasks at the moment is scanning for potential sites in Yemen using satellite imagery available through Google Earth. This process is complemented by knowledge of previous archaeological surveys in the region.

Fig 1: An example of sites pinned in northern Yemen using Google Earth interface.
In any archaeological investigation it is important to compile the previous projects that have investigated the site or region of interest. This requires the analysis and digitisation of previous archaeological and heritage surveys.
I have been compiling a list of archaeological surveys for the southern region of Jordan. Finding some of these gazetteers can be extremely difficult – some are published in an obscure periodical only available in print, a low-print-volume book, or some unfortunately may never have been published at all. Another difficulty is that some will have been compiled when GIS and GPSs were not as accessible or accurate as they are today. Surveys may also use different projection systems. Common for Jordan surveys is the Palestine Grid/Old Israeli Grid in older surveys, and the Universal Transverse Mercator (UTM) in modern surveys, but sometimes a survey may use the less common Jordan Transverse Mercator and not clearly state which they are using! These surveys need to be transformed into a common coordinate system in order to view them together, but the digitisation into a GIS is a sure way to start being able to check, analyse and correlate the data in preparation before we can enter the site information into our database.
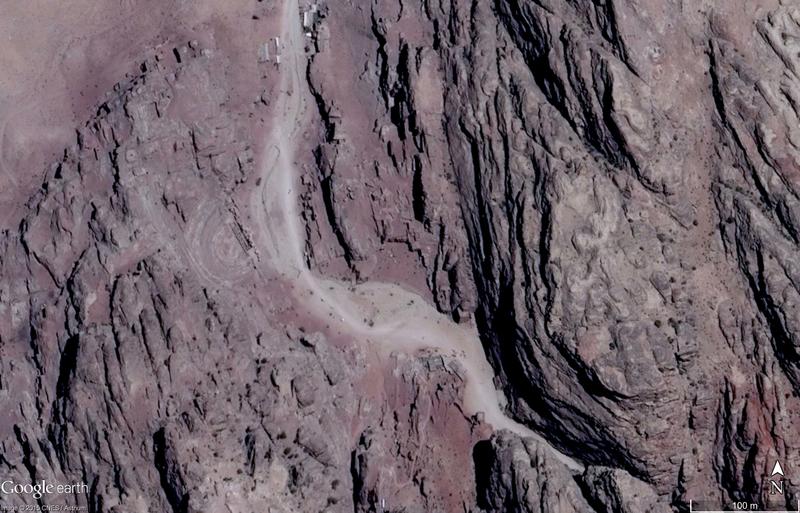
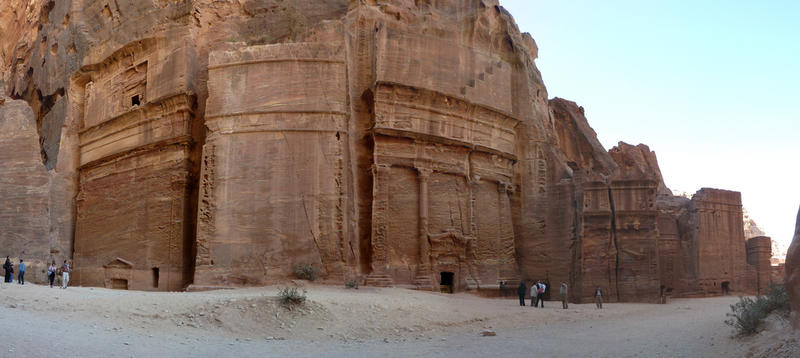
These surveys may confirm assessments we have made based on the available imagery, but may also contain locations of sites that we will not be able to detect easily, or at all, using the imagery available to us. This may be because the site is too small (a single burial), ephemeral (temporary camps), created or positioned in such a way that it does not appear in imagery (a cave or rock face relief), or has already been damaged to the extent it is no longer visible as a surface feature. For the area of Jordan I am investigating, the surveys conducted in the Wadi Faynan area are crucial to help pinpoint the location of copper and other mining sites. These are extremely difficult to detect in vertical satellite imagery, but are also the type of site that is at high risk due to their association with such a desirable commodity. The rock face reliefs and tombs of Petra are likewise difficult to discern from satellite imagery.


Fig 2a and 2b: Petra satellite and Petra Facades: This satellite imagery (sourced from Google Earth) of the western entrance to the Siq at Petra is profusely lined with rock cut tomb facades to the extent it is known as the ‘Street of Facades’ (Photograph: Rebecca Banks), but the most prominent feature visible on the satellite image is the theatre.
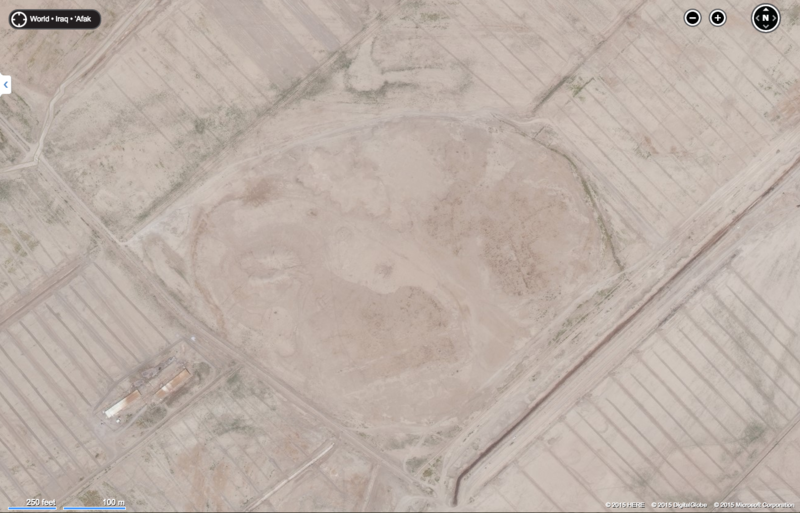
Locational data is not the only data we can gain from these sources. Information regarding site size, extent, elements, character and date are all gathered through ground survey, and their analysis is conducted in much more detail than can be done through remote sensing. Likewise, damage that cannot be seen, or only inferred, in satellite imagery can be informed or confirmed by ground survey. For example, the extensive survey in Iraq by Robert McC. Adams (1981, Heartland of Cities, University of Chicago Press, Chicago and London) recorded not only the pitting of sites by looting which is quite visible in aerial imagery, but also the impact of high salinity in the water table on archaeological tells’ ceramics gathered for analysis.

Fig 3: Tell Dlehim: This Tell site in Iraq suffers ‘poor drainage and high soil salinity’ that has caused considerable damage to its ceramic finds according to Adams’ survey (Heartland of Cities Site 1237). The satellite imagery (here sourced from Bing Maps) only demonstrates impacts from encroaching agriculture, infrastructure, site erosion, and minor pitting – likely from looting.
Our understanding of a site will be greatly increased where multiple surveys exist. These will not only allow a comparison of the condition of a site over time, but a fuller understanding of the nature of the site itself based on the different types of archaeological survey undertaken. Archaeology is an ever-evolving science and certain theories or methods regarding site or artefact analysis will change as the science is refined or becomes more affordable to implement. Previous survey or our interpretations are by no means the end of analysis. For example: a survey may have recorded a large site based on a dateable artefact scatter. The extent of this site may be subsequently revised, or re-investigated, due to the visibility of surface/subsurface features via remote sensing. Finally, a later survey using geophysical survey methods might record an even larger area due to the detection of subsurface features over a broader area. All of these approaches to survey are complimentary and tell us about different aspects of the site.
Our knowledge about sites is improved if all available information is brought together and this is an important aspect of EAMENA’s work to aid our interpretations and improve our records.


